Weekly BulletinHello folks, Hope you've all had a great week. Two things I want to cover this week. As you've probably noticed, bitcoin broke some bearish major macro trend lines and surpassed the $5,000 mark for the first time in months. Next we have the SEC who released an official statement about analyzing whether a digital asset is a security or not. Let's jump into it. The SEC and their frameworkYou can read their framework here. You probably don't want to tho, because it's 13 pages of boring legal jargon. The analysis from Coin Center is a much better read (if you're interested). Most of you aren't here for homework assignments, so here's a TL;DR from the Coin Center analysis.
Sooo, yeah. There's really nothing new here. Onto the markets! Market SentimentBefore we startDon't listen to folks who after-the-fact come up with great theories to explain price movement. What matters here is not how good someones analysis is about the outcome, but how much one makes when one is right. If you see someone come up with theories about the markets in hindsight, you can almost be certain they have no skin in the game.
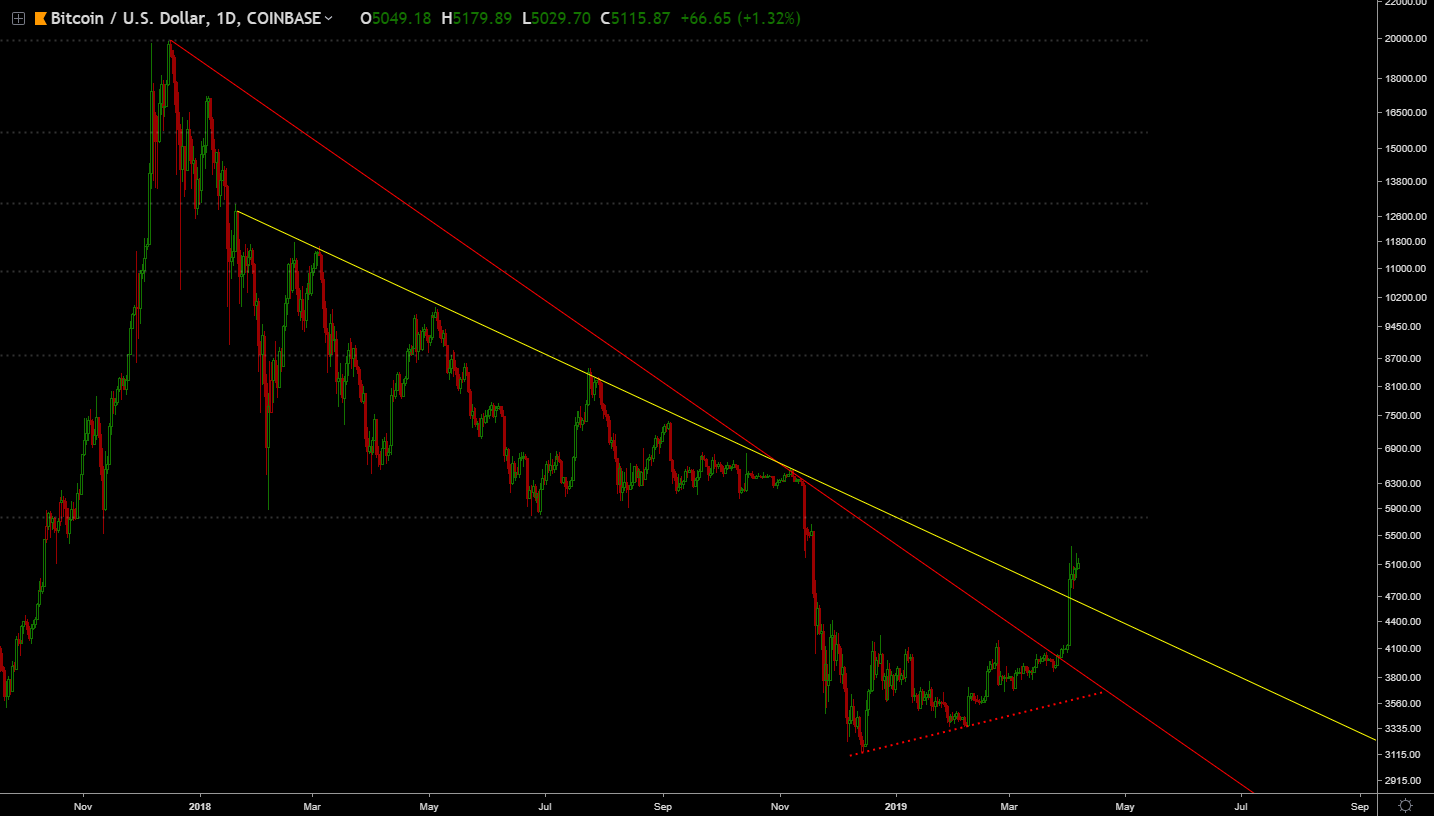
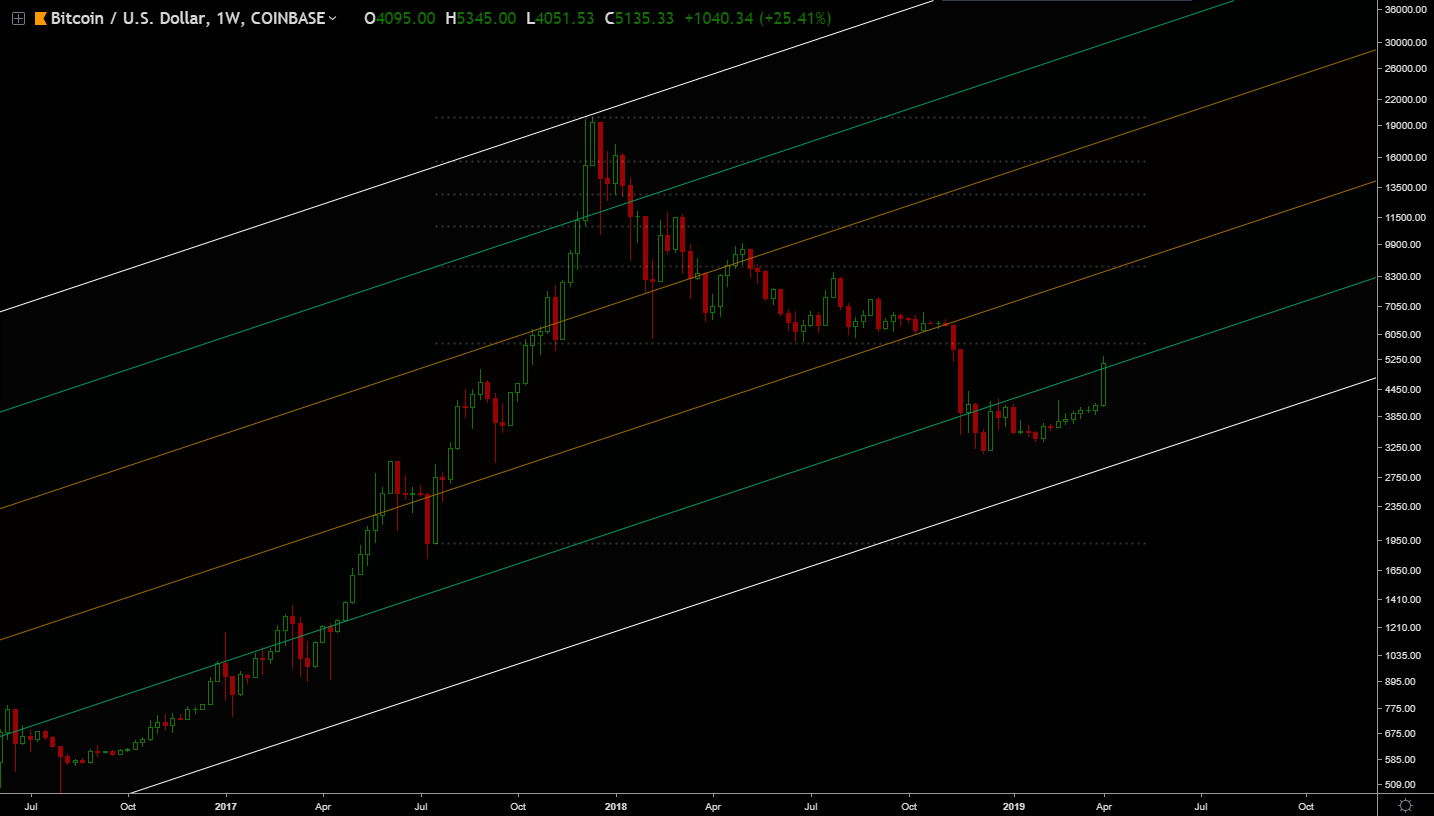
So, is the bear market really over?Maybe. It's looking really good so far. I've been showing you these trend lines for the last 7 weeks or so.
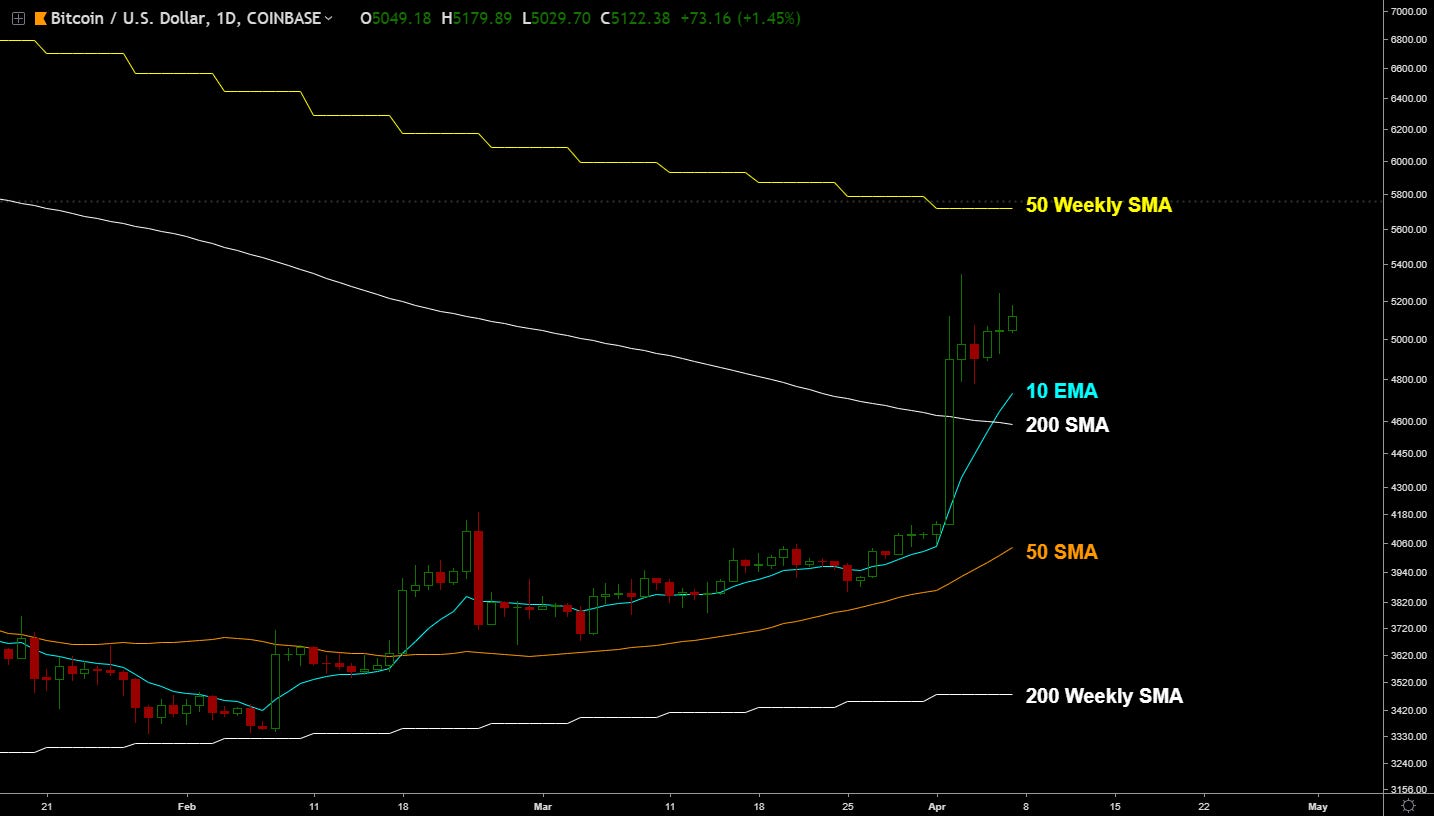
And we finally broke through them. I thought we would have another 2-4 weeks of rejections and sideways action. But I was wrong, and we broke through (rather suddenly). Trading opportunitiesTrading laggard large caps meta is back. Here's an English translation. A laggard is the opposite of a leader, and tends to be something that is under-performing, or falling behind. The thesis here is that since the crypto market isn't perfect, there will be coins that you can buy for a discount, because their price moves slower then the price of another coin. For example, litecoin price has been moving quicker then bitcoin, so there was an opportunity to make more bitcoin buy trading litecoin. This is what I've been doing lately. I'm currently watching ETH. Bitcoin (Moving Averages)We just had 10 EMA / 200 SMA crossover on the daily chart. This is a pretty bullish move. At this point a 50 SMA / 200 SMA crossover would pretty much confirm that we are in a bull market. That 50 Weekly SMA is also the next level of resistance.
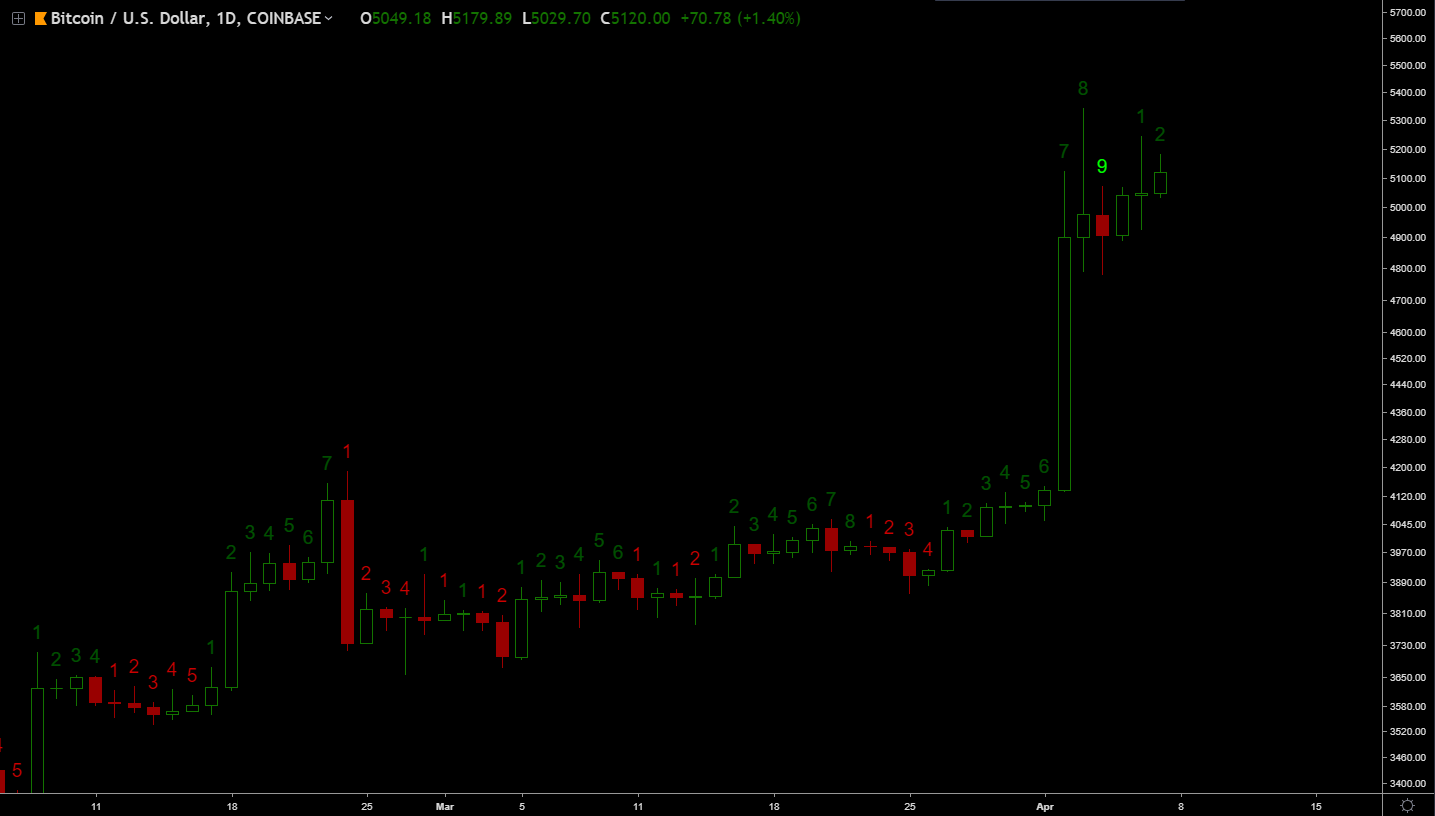
The TDIn the beginning of March, I mentioned that it's a good time to pay attention to the TD Sequential. The monthly count didn't get us to that perfect 9 / 13 count, but it was very close. The monthly count was suggesting to us that the bear trend was exhausting.
The weekly and daily count is suggesting a short pull back, but given the current hype and the relatively bullish macro indicators (like the monthly count, trend lines, and moving averages), we likely won't see too much downside. We'll likely see action similar to what we saw on that daily 9 candle.
(Daily 9 candle below)
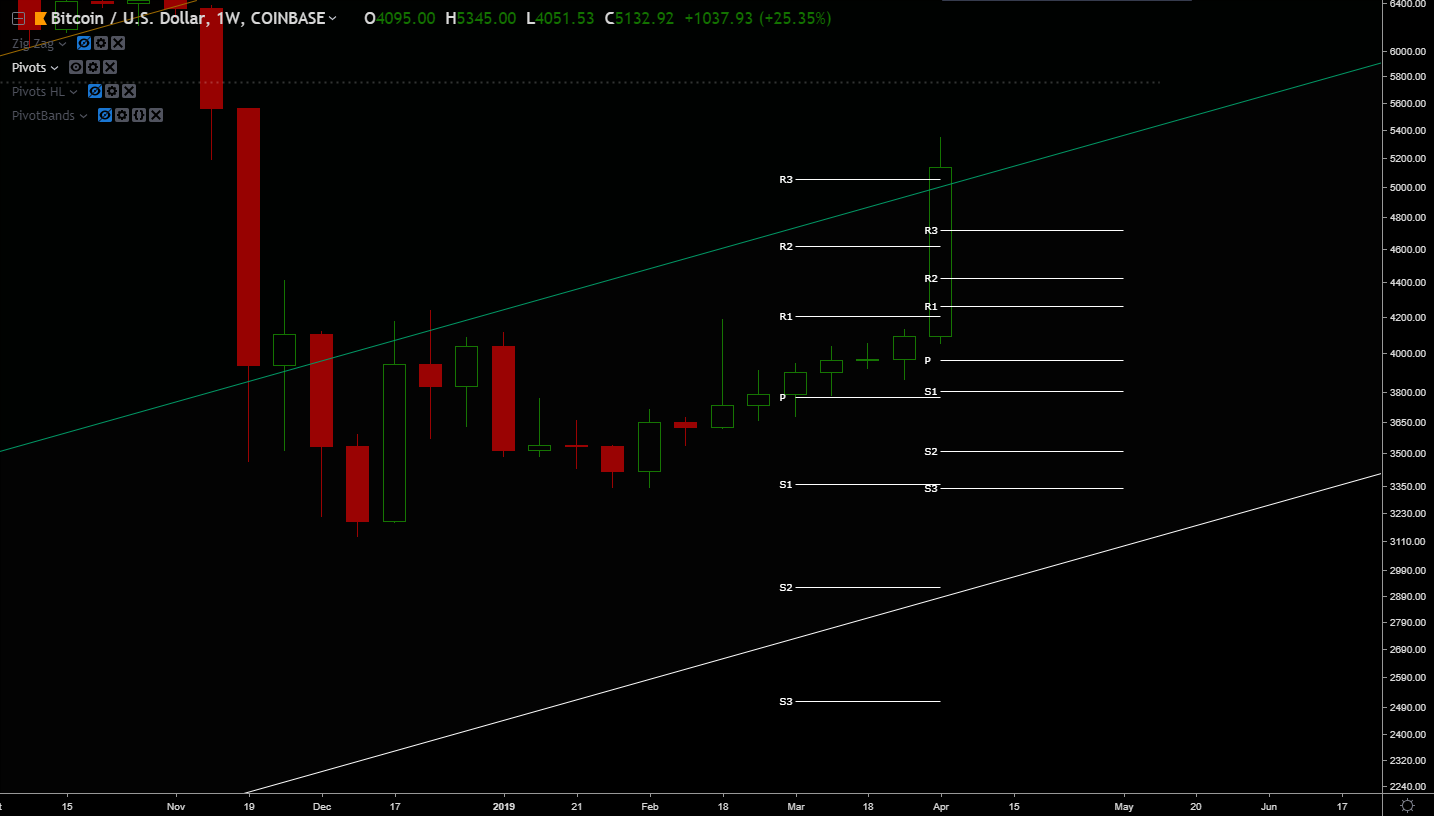
Bitcoin (Monthly Support/Resistance Levels)
Bitcoin (Macro Overview)I've been sharing this macro chart for a long time, and it's not even the most bullish macro chart out there (but it is easy to look at). Still, right now it looks great.
The endWhat do you folks think? Continue the discussion in our Telegram group. That's all for now. See you later space Cowboy -Dmitriy You're on the free list for CoinSheet. For the full experience, become a paying subscriber. |


